Popular Types of Charts

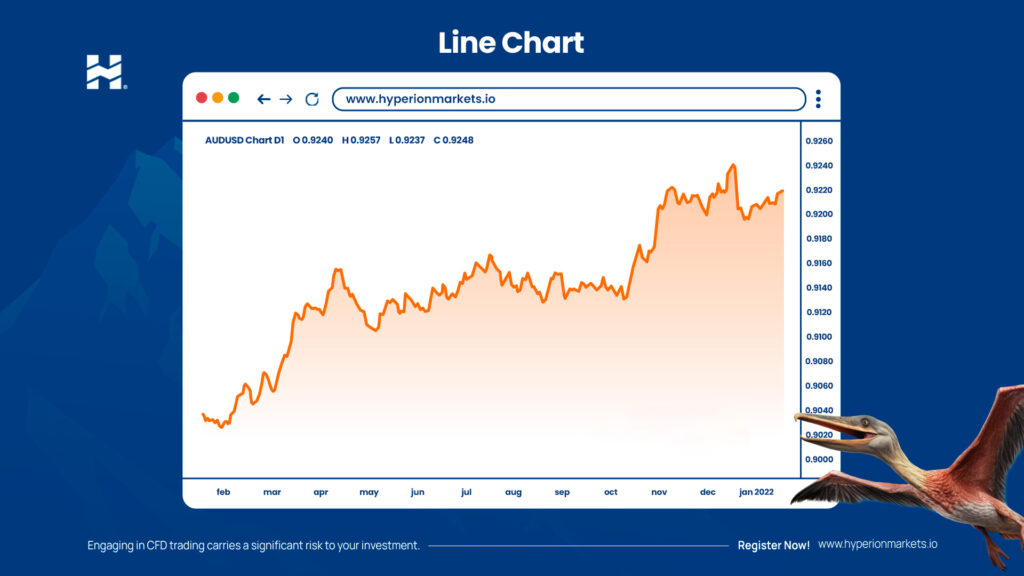
Line Chart
- The line chart is the most basic type of chart. It represents the closing price of an asset over time by a line connecting the closing points.
- It provides an overview of the asset’s trend over time.
- It is useful for identifying general trends but lacks details about opening prices, highs, and lows.
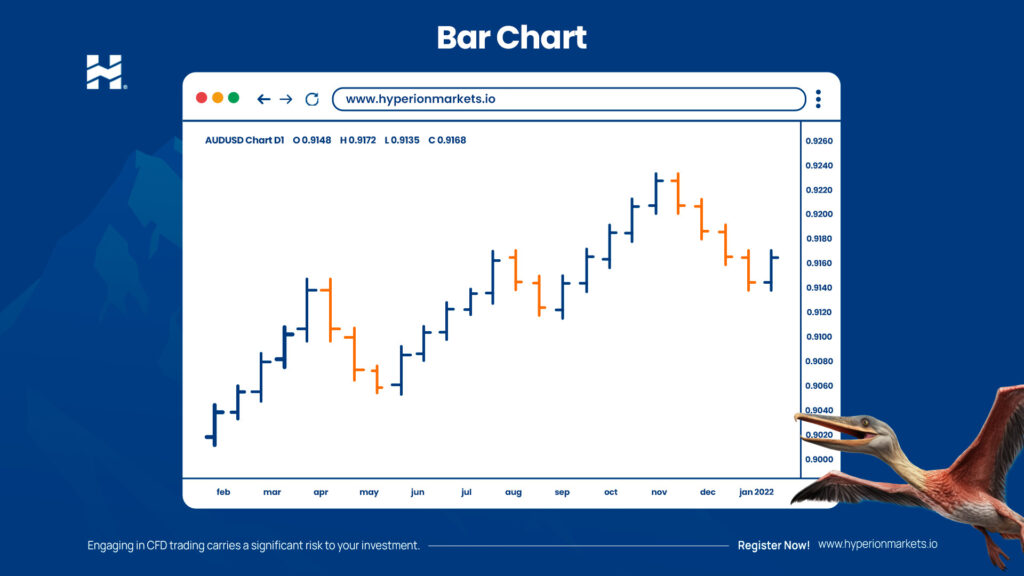
Bar Chart
- The bar chart represents the opening price, closing price, high, and low of an asset over a specific period of time.
- Each vertical bar shows the price range during that period.
- Bars are used to identify patterns and changes in market volatility.
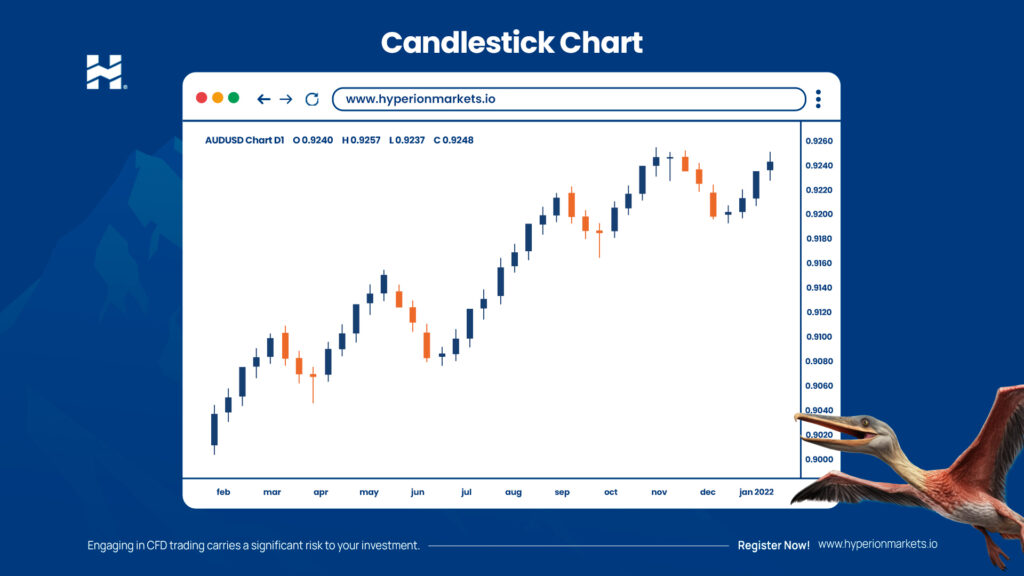
Candlestick Chart
- The candlestick chart is similar to the bar chart and displays the opening price, closing price, high, and low but in a more visual and easy-to-interpret manner.
- Each “candle” consists of a rectangular body (the difference between the opening and closing price) and wicks (the lines extending from the body, representing highs and lows).
- Candles are used to identify reversal patterns such as hammer, shooting star, doji, and many others.
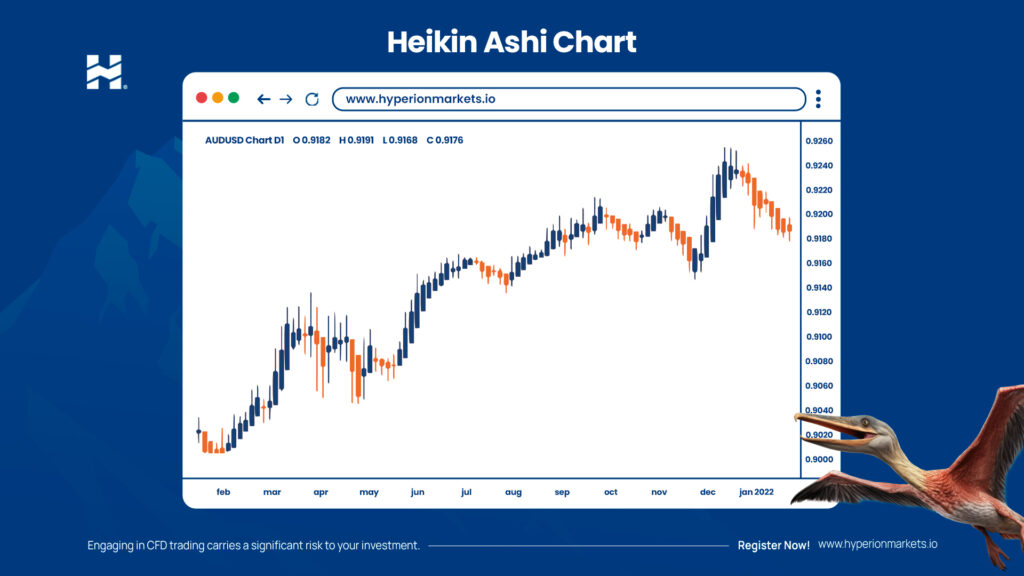
Heikin Ashi
- Heikin Ashi is a type of chart used in technical analysis of trading that smooths price movements. Instead of representing exact market prices, it calculates opening, closing, high, and low prices in a special way, which helps visualize trends and changes in price direction more clearly.
- Due to its smoothing, Heikin Ashi charts can help reduce false signals of trend reversal.
- They are useful for capturing prolonged movements in one direction without the interference of minor fluctuations.
Always remember, no type of chart or indicator is infallible. Traders should use multiple tools and strategies and understand the risks associated with trading.