Candlestick Patterns

Basic Japanese candlestick patterns are graphical representations of price action on a candlestick chart that can provide signals about potential future movements in the market. Here are some of the most basic Japanese candlestick patterns:
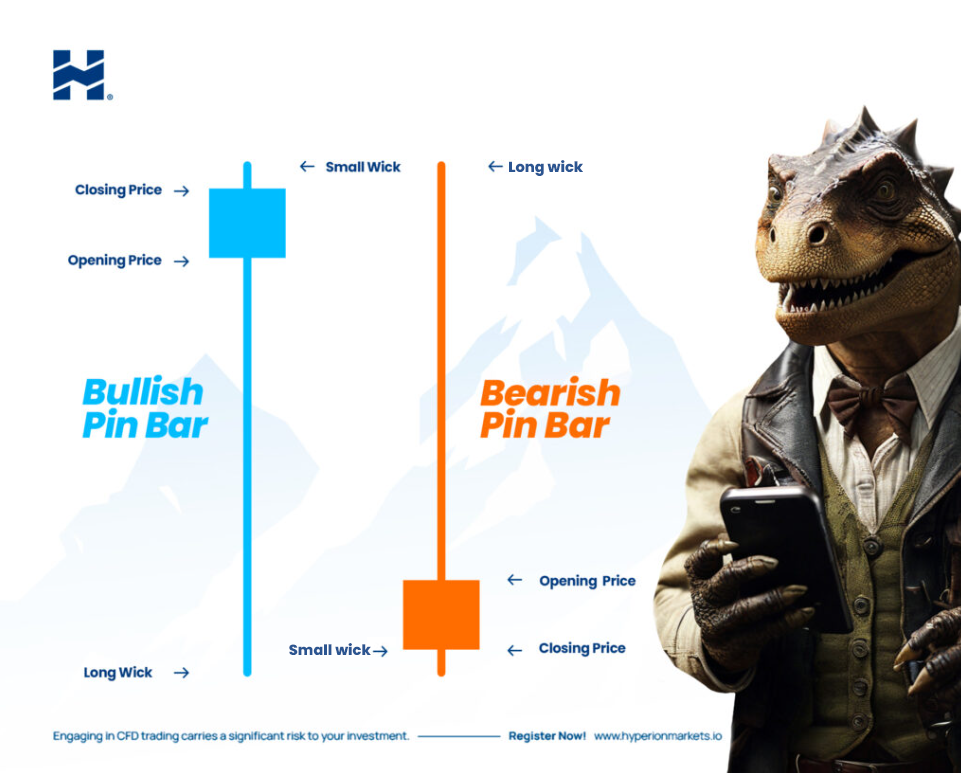
Pin Bar Pattern
- A Pin Bar Pattern (hammer) is a candle with a small body at the top and a long wick at the bottom.
- It indicates a possible bullish reversal after a downtrend. Buyers overwhelmed sellers at the end of the period.
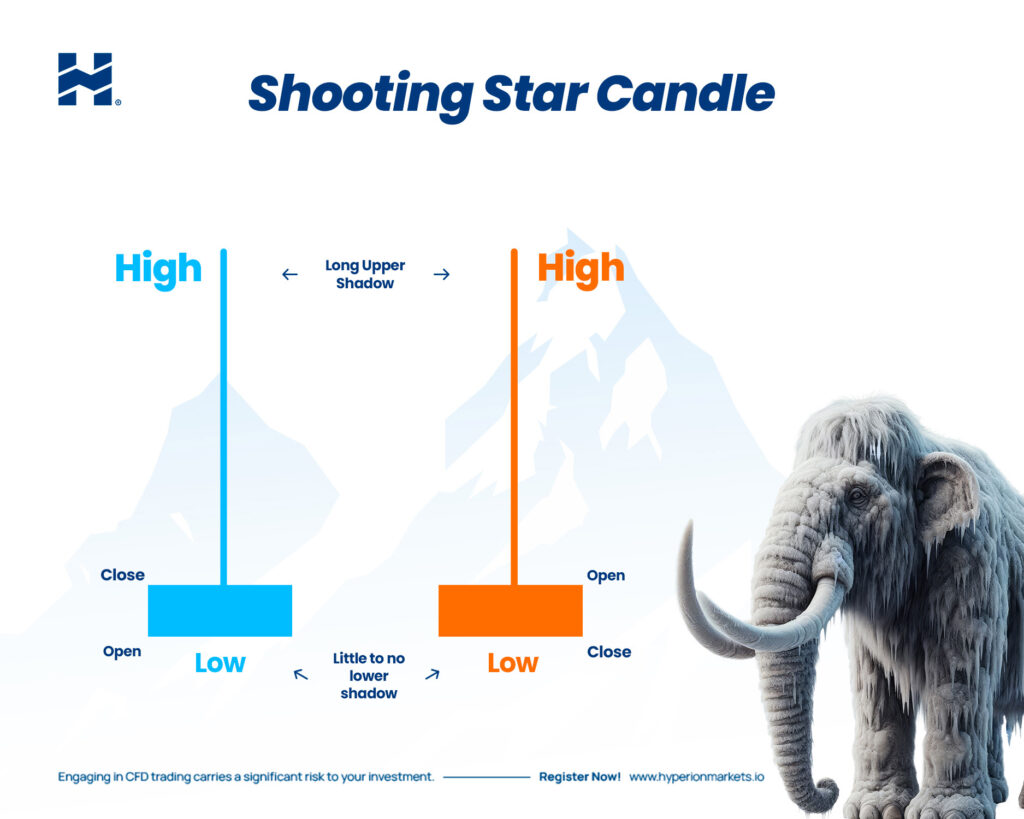
Shooting Star Pattern
- shooting star is similar to a hammer but appears at the end of an uptrend.
- It indicates a possible bearish reversal, as sellers overwhelmed buyers at the end of the period.
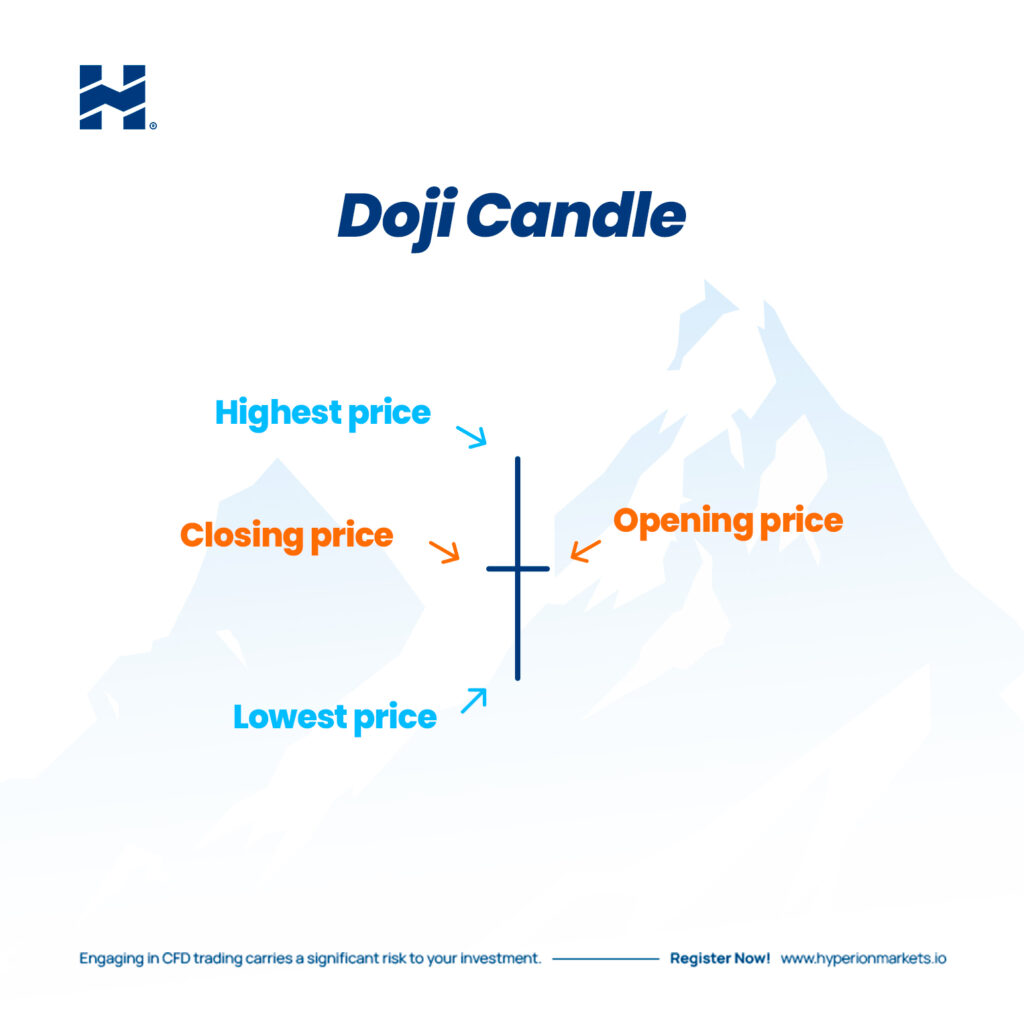
Doji Pattern
- A doji is a candle with a very small body that opens and closes near the same price.
- It indicates market indecision and may signal a possible trend reversal.
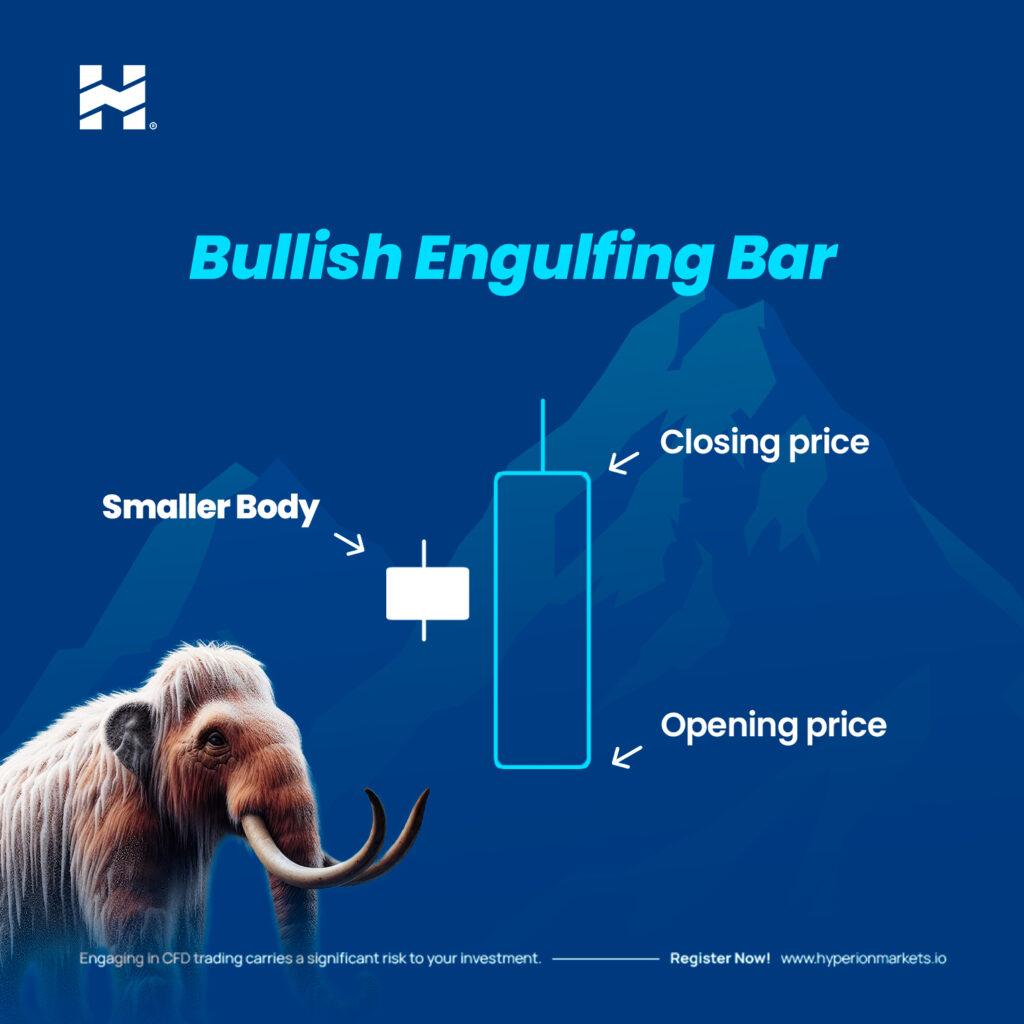
Bullish Engulfing Pattern
- A bullish pattern in which a bullish candle “engulfs” the entire previous bearish candle.
- It suggests a potential change from a downtrend to an uptrend.
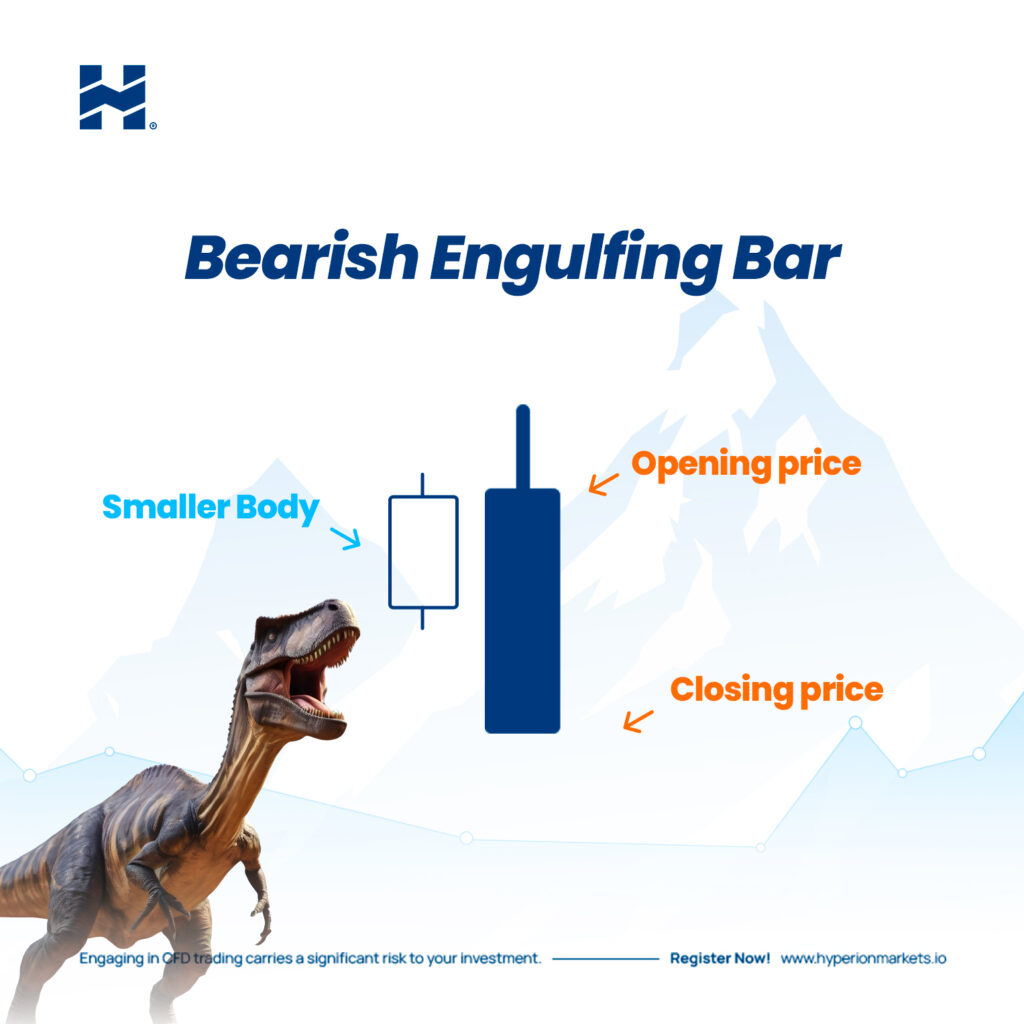
Bearish Engulfing Pattern
- A bearish pattern in which a bearish candle “engulfs” the entire previous bullish candle.
- It indicates a potential change from an uptrend to a downtrend.
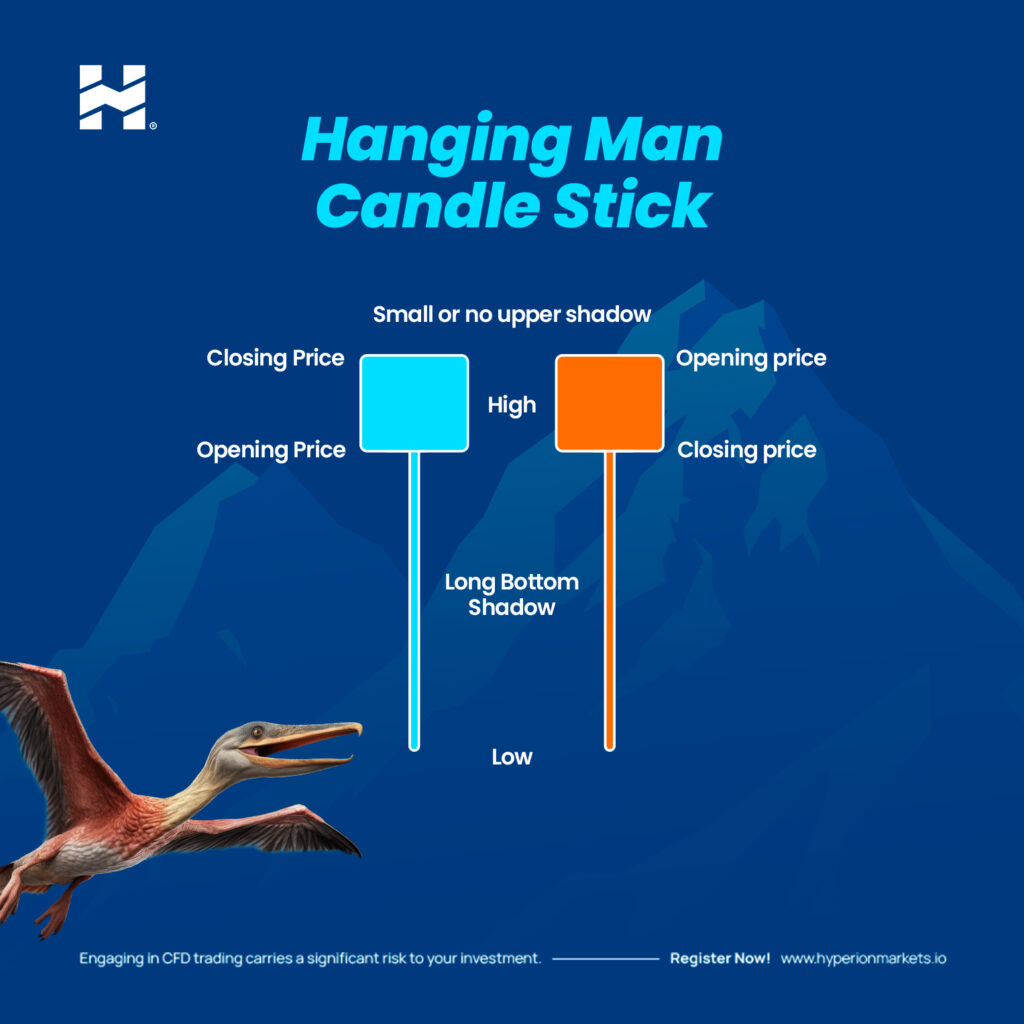
Hanging Man Pattern
- Similar to a hammer but appears at the end of an uptrend.
- It may indicate a possible bearish reversal.
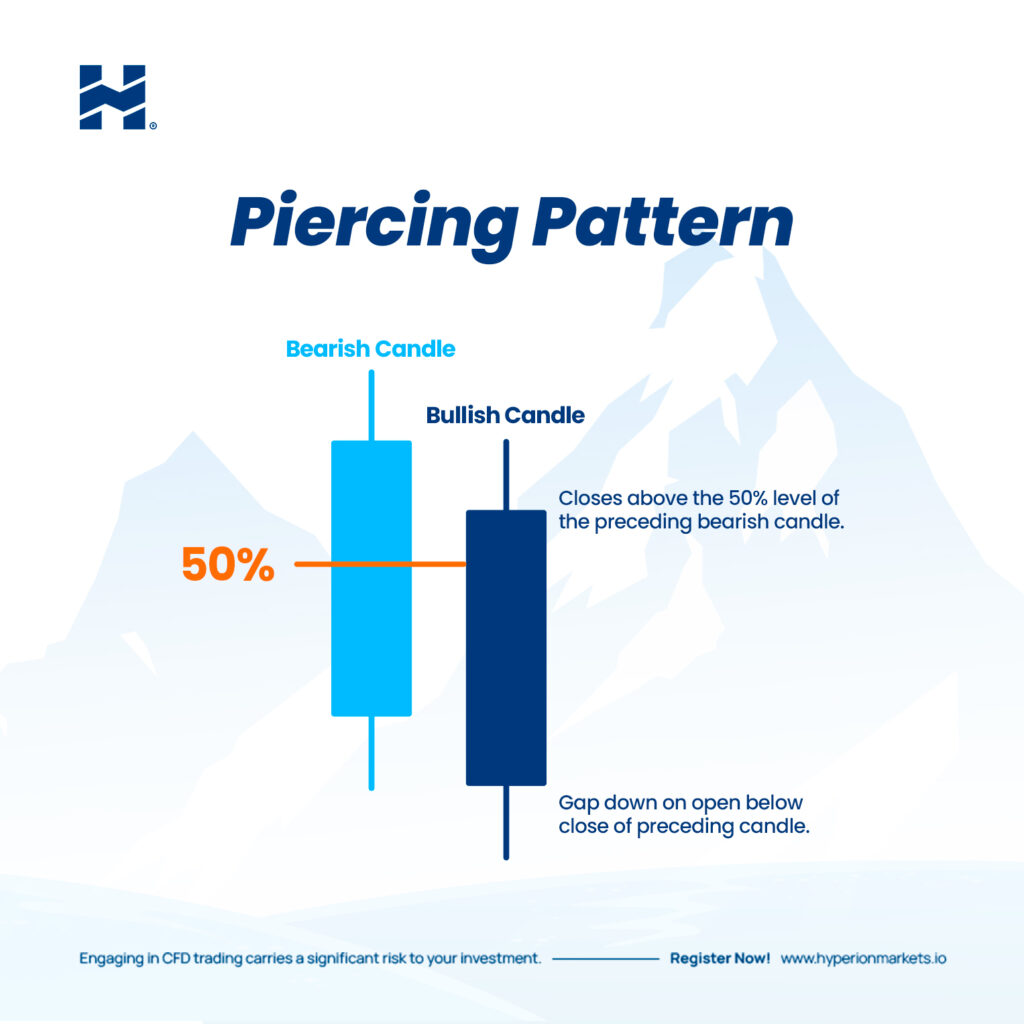
Piercing Pattern
- A bullish pattern in which a bullish candle closes above the midpoint of the previous bearish candle.
- It suggests a potential bullish reversal.
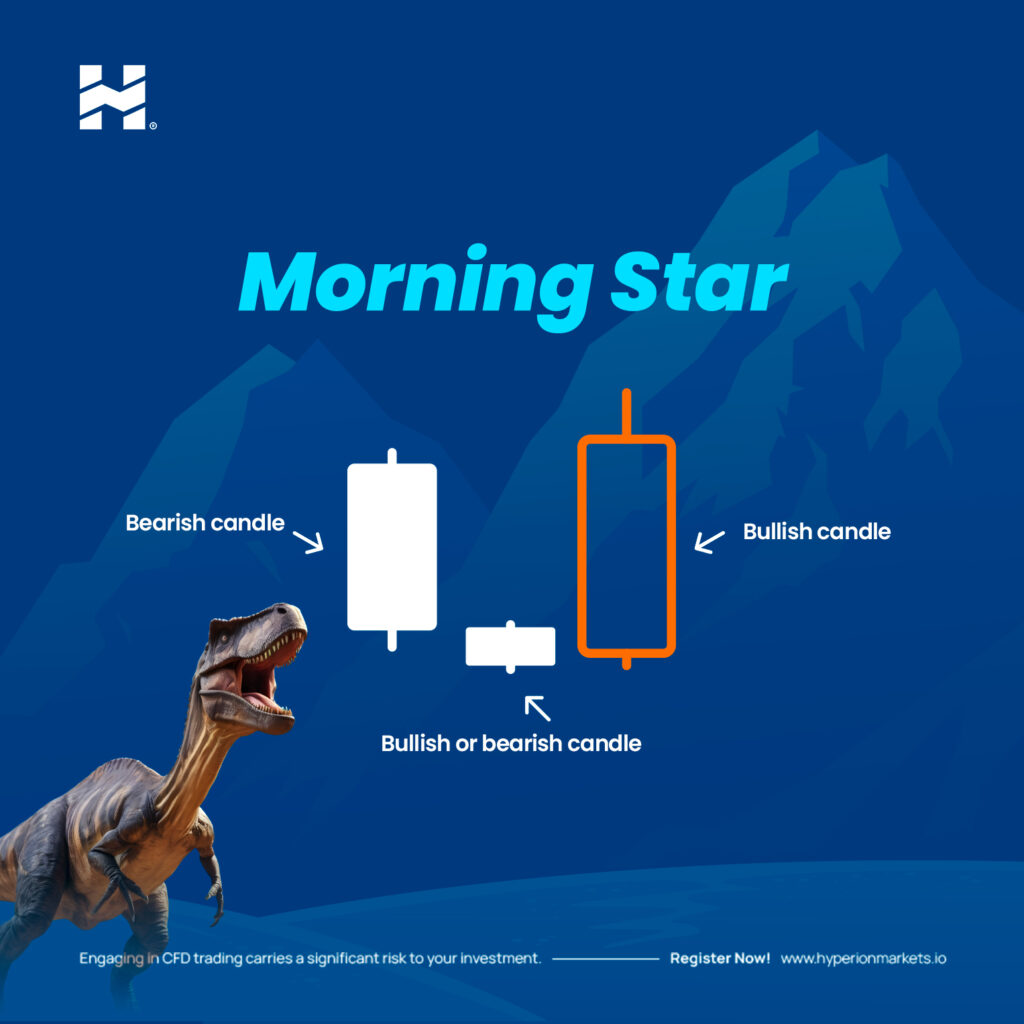
Morning Star Pattern
- A bullish pattern consisting of a bearish candle, followed by a doji or small candle, and then a bullish candle.
- It indicates a possible change from a downtrend to an uptrend.
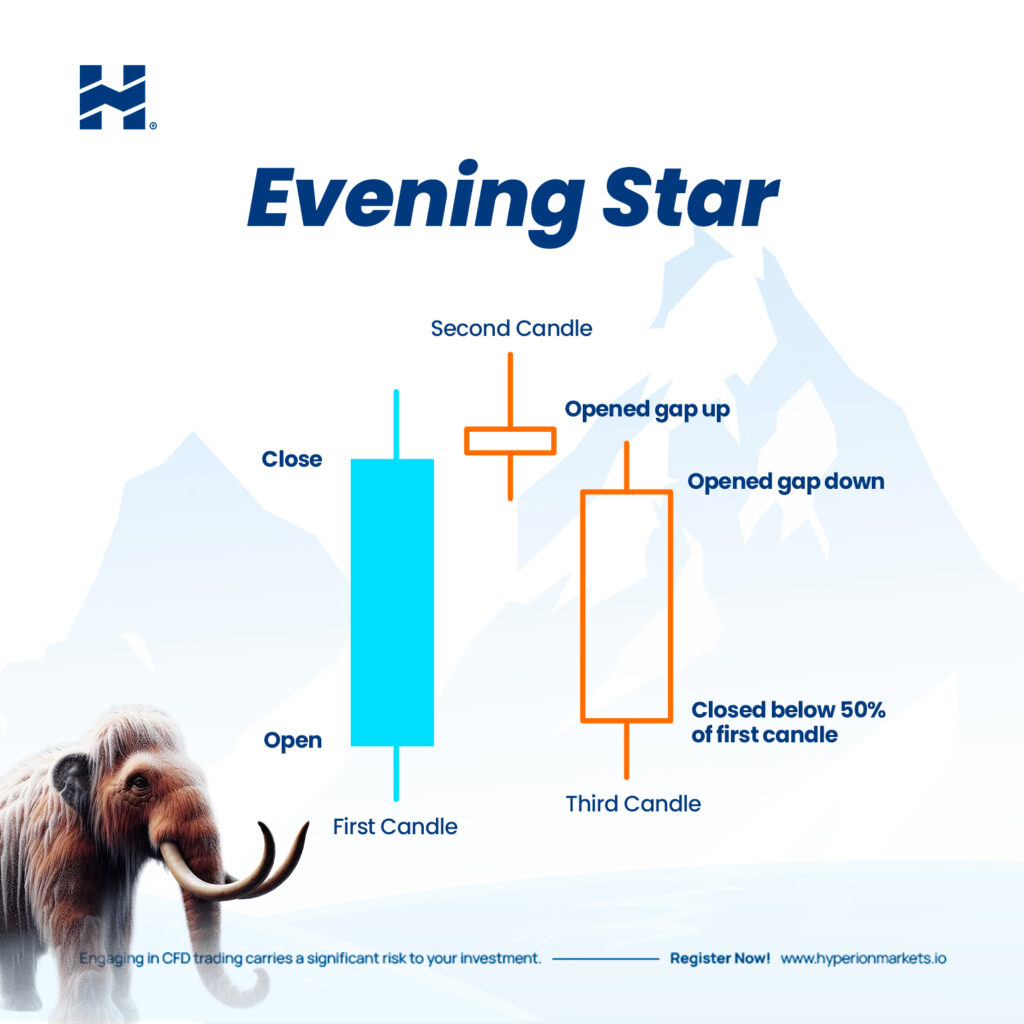
Evening Star
- A bearish pattern consisting of a bullish candle, followed by a doji or small candle, and then a bearish candle.
- It suggests a possible change from an uptrend to a downtrend.