What is a Japanese Candlestick?

A “Japanese Candlestick” is a graphical representation of price action over a specific period of time. These candlesticks are used in technical analysis to visualize and understand the price movements of financial assets such as stocks, currencies, commodities, and cryptocurrencies. Japanese candlesticks provide information about the opening, closing, highs, and lows of an asset during a specific period.
Each Japanese candlestick consists of two main parts:
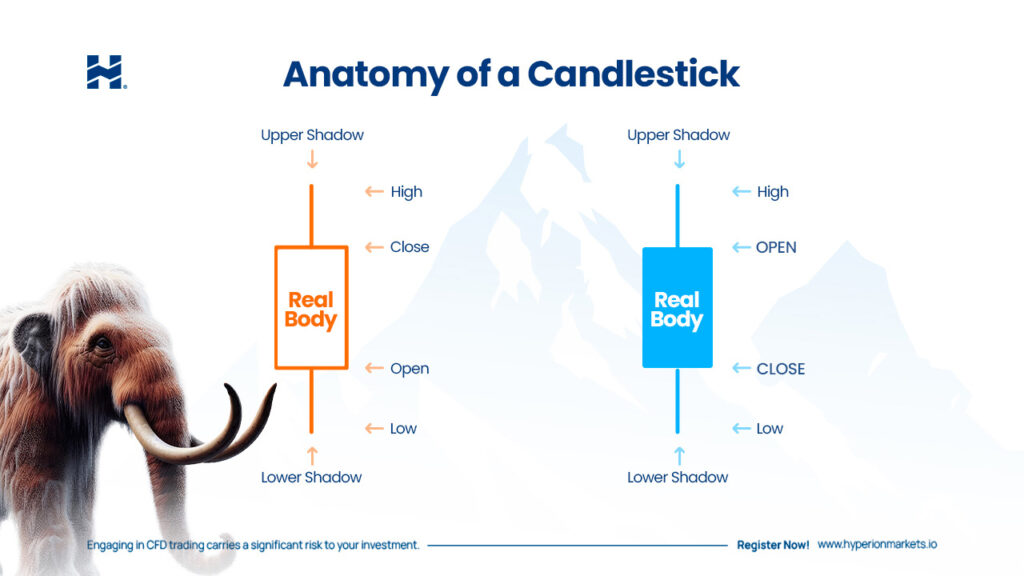
Body: The body of the candle represents the difference between the opening price and the closing price during the specified time period. If the closing price is higher than the opening price, the candle’s body is bullish (usually represented in green or white). If the closing price is lower than the opening price, the candle’s body is bearish (usually represented in red or black).
Wicks or Shadows: The wicks or shadows are the thin lines extending from the top and bottom of the candle’s body. They represent the highest and lowest prices reached during the period. The upper wick shows the maximum price, and the lower wick shows the minimum price.