What are patterns in charts?

Patterns in charts are repetitive and predictable formations that can be found on price charts of financial assets. Traders use these patterns to make trading decisions, as they can provide signals about the potential future direction of prices.
Below are briefly described the most popular patterns:
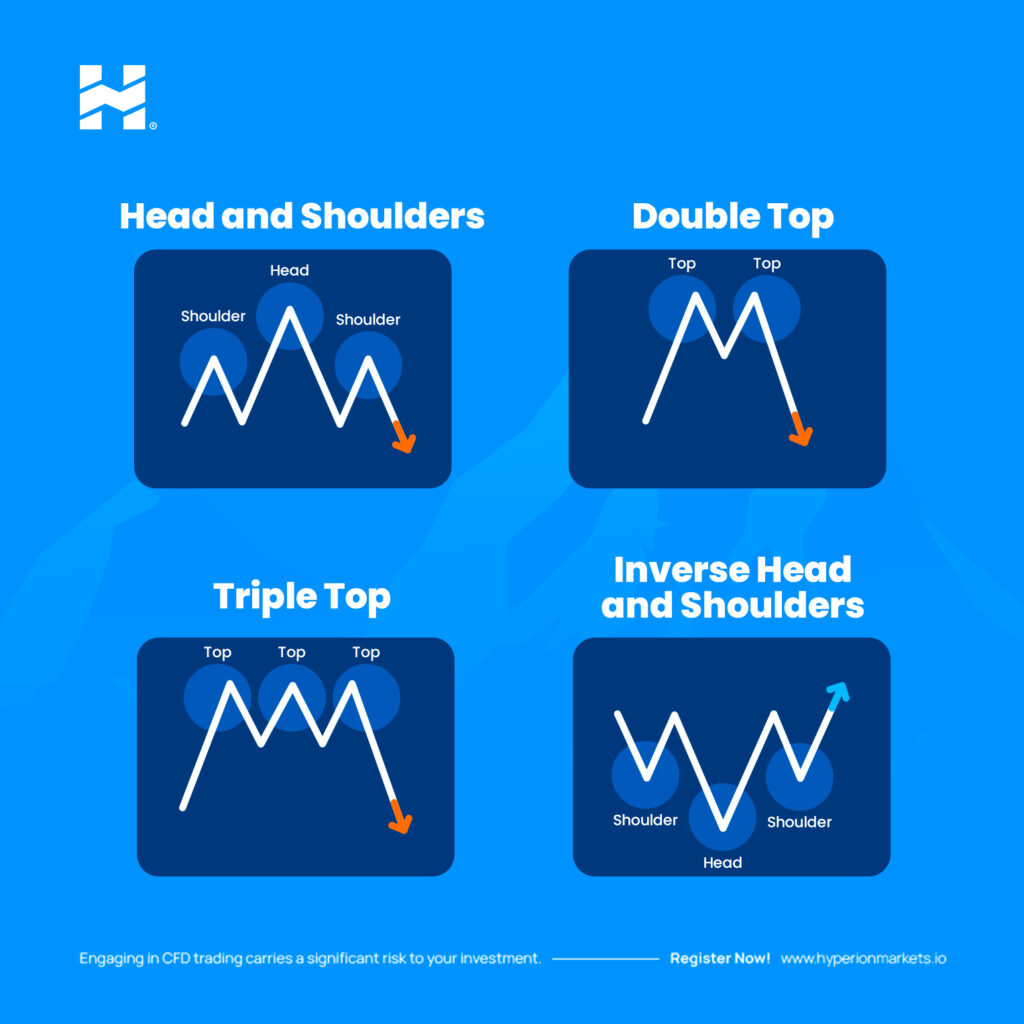
- Double Top: This pattern forms after an uptrend and shows two peaks in price, followed by a bearish reversal. It is considered a sell signal and may indicate exhaustion of the uptrend.
- Double Bottom: Unlike the double top, the double bottom forms after a downtrend and shows two valleys in price followed by a bullish reversal. It is considered a buy signal and may indicate a possible change in trend direction.
- Head and Shoulders: This pattern is a bearish trend formation consisting of three peaks, with the central peak (the “head”) higher than the other two (the “shoulders”). It is a sell signal and suggests a possible reversal from bullish to bearish trend.
- Inverse Head and Shoulders: It is the reverse version of the previous pattern. It forms after a downtrend and consists of three valleys, with the central valley lower than the other two. It is a buy signal and suggests a possible reversal from bearish to bullish trend.
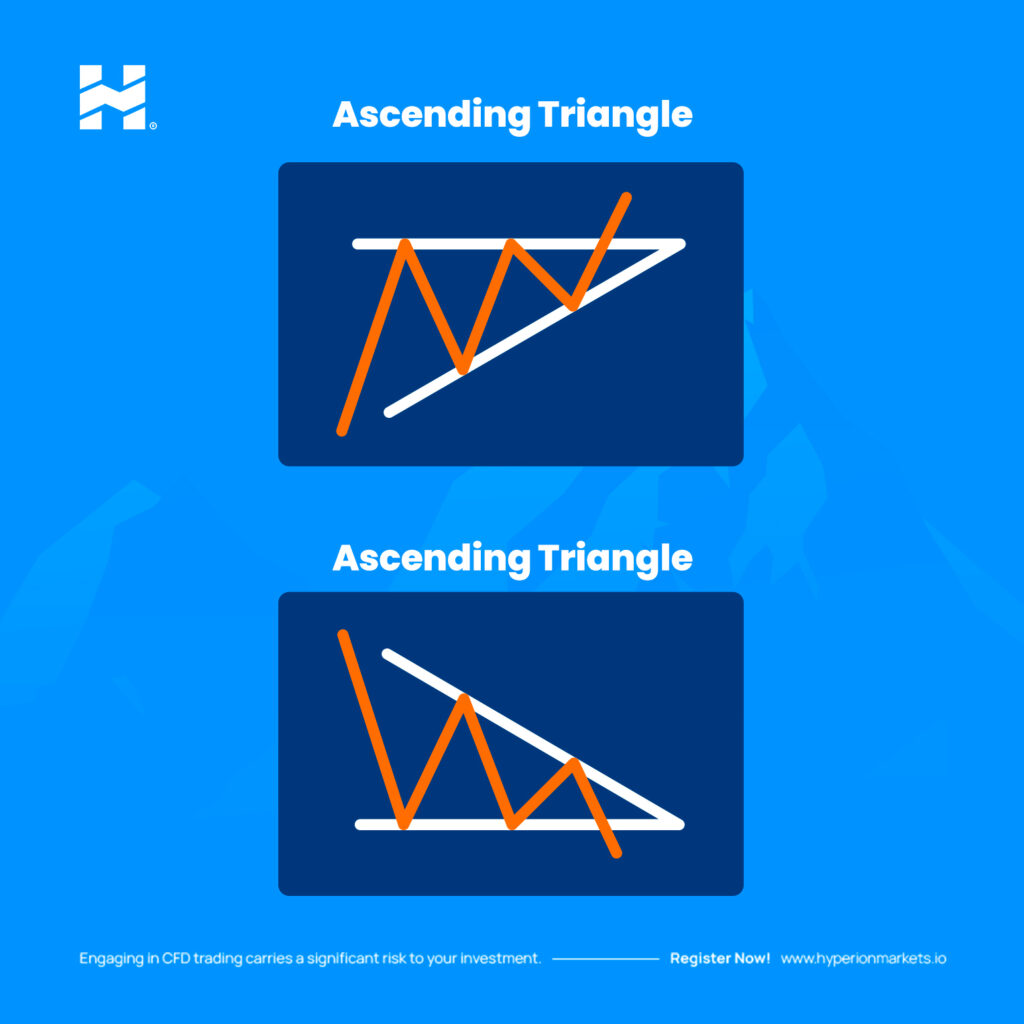
- Ascending Triangle: This pattern is a consolidation formation that forms during an uptrend. It shows a horizontal resistance line and an ascending trendline. It is considered a bullish signal and suggests that the uptrend could continue.
- Descending Triangle: It is the inverse version of the ascending triangle and forms during a downtrend. It shows a horizontal support line and a descending trendline. It is considered a bearish signal and suggests that the downtrend could continue.