What are indicators in trading?

Indicators in trading are technical tools used to analyze and better understand price movements in financial markets. These indicators help traders make informed decisions about when to buy, sell, or hold a financial asset. Indicators are based on mathematical and statistical formulas that transform price data into easier-to-interpret information.
Utility of indicators:
- They help identify trends in prices.
- They offer buy or sell signals.
- They assist in risk management.
- They provide information about market strength and volatility.
The most well-known indicators are:
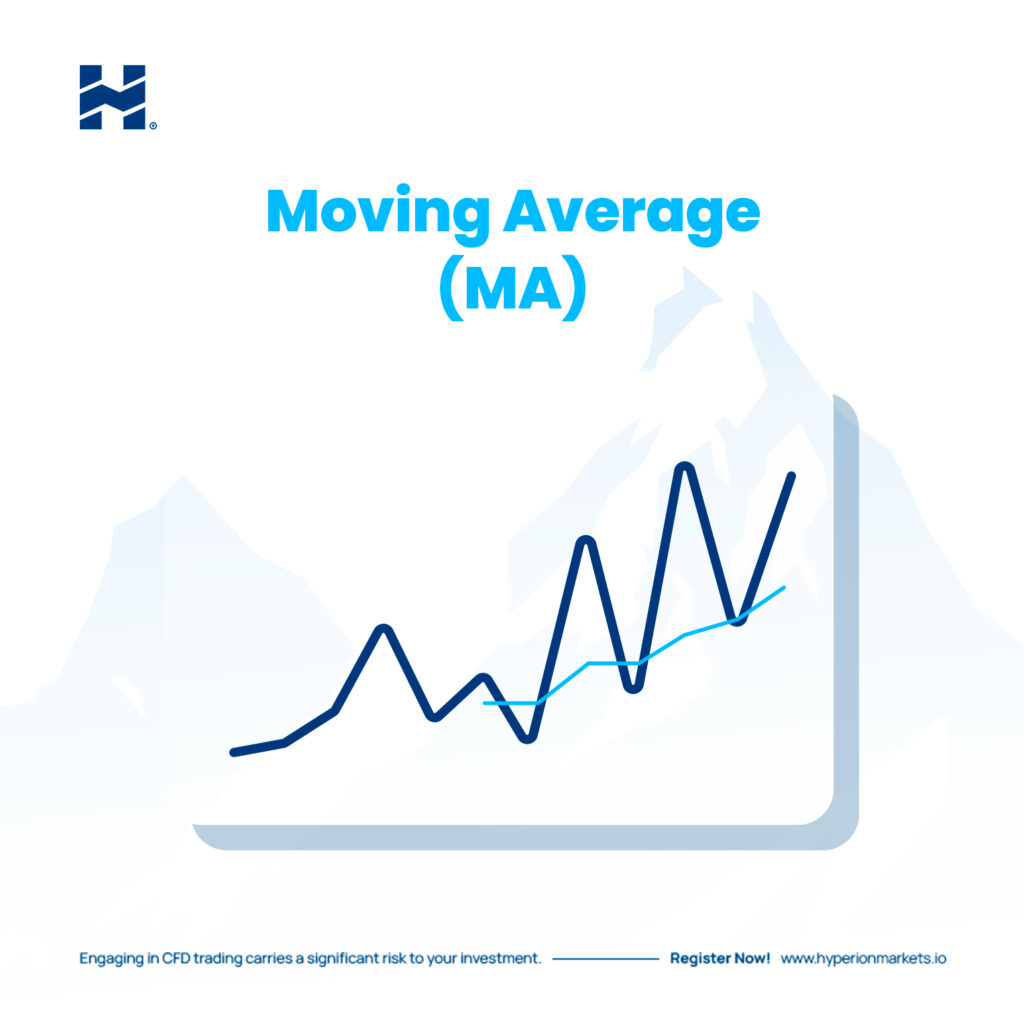
Moving Average (MA)
A moving average is a tool that smooths and displays the trend of prices for a financial asset. It is calculated by averaging past prices over a chosen period (e.g., 10 days).
This helps traders identify whether the trend is bullish, bearish, or sideways, which in turn helps them make buying or selling decisions in the market.
There are two main types: the simple moving average (SMA) and the exponential moving average (EMA). The choice of the moving average period affects its sensitivity. SMA and EMA are common tools in technical analysis for trading.
The Exponential Moving Average (EMA) is a tool used in trading to understand price trends. The main difference from the Simple Moving Average (SMA) is that the EMA pays more attention to recent prices.
To calculate the EMA, you take an average of past prices as a starting point and then give more weight to more recent prices. This makes the EMA react faster to price changes.
In summary, the EMA helps traders see price trends more immediately, which can be useful if you want to make quick decisions in trading.
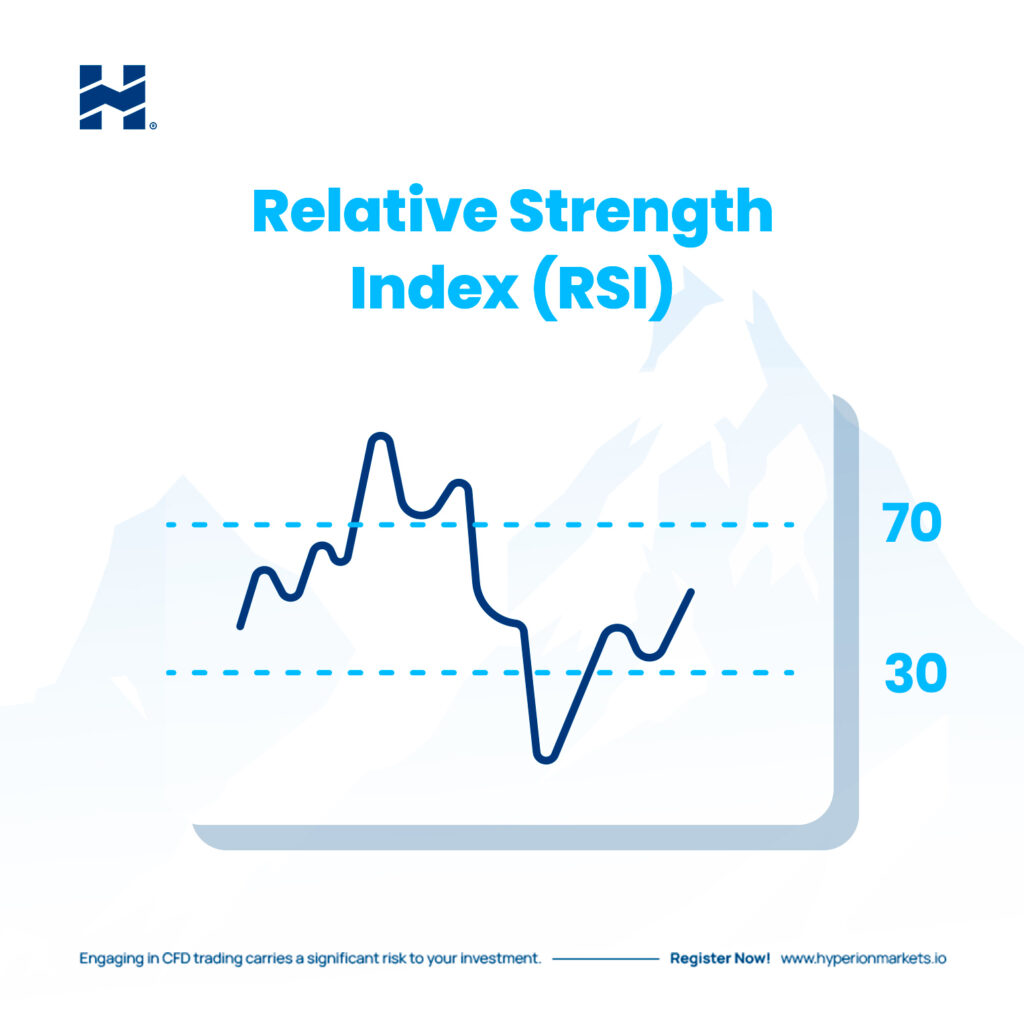
RSI (Relative Strength Index)
RSI measures the speed and magnitude of price changes. It is used to identify overbought and oversold conditions in an asset, which can signal potential trend reversal points.
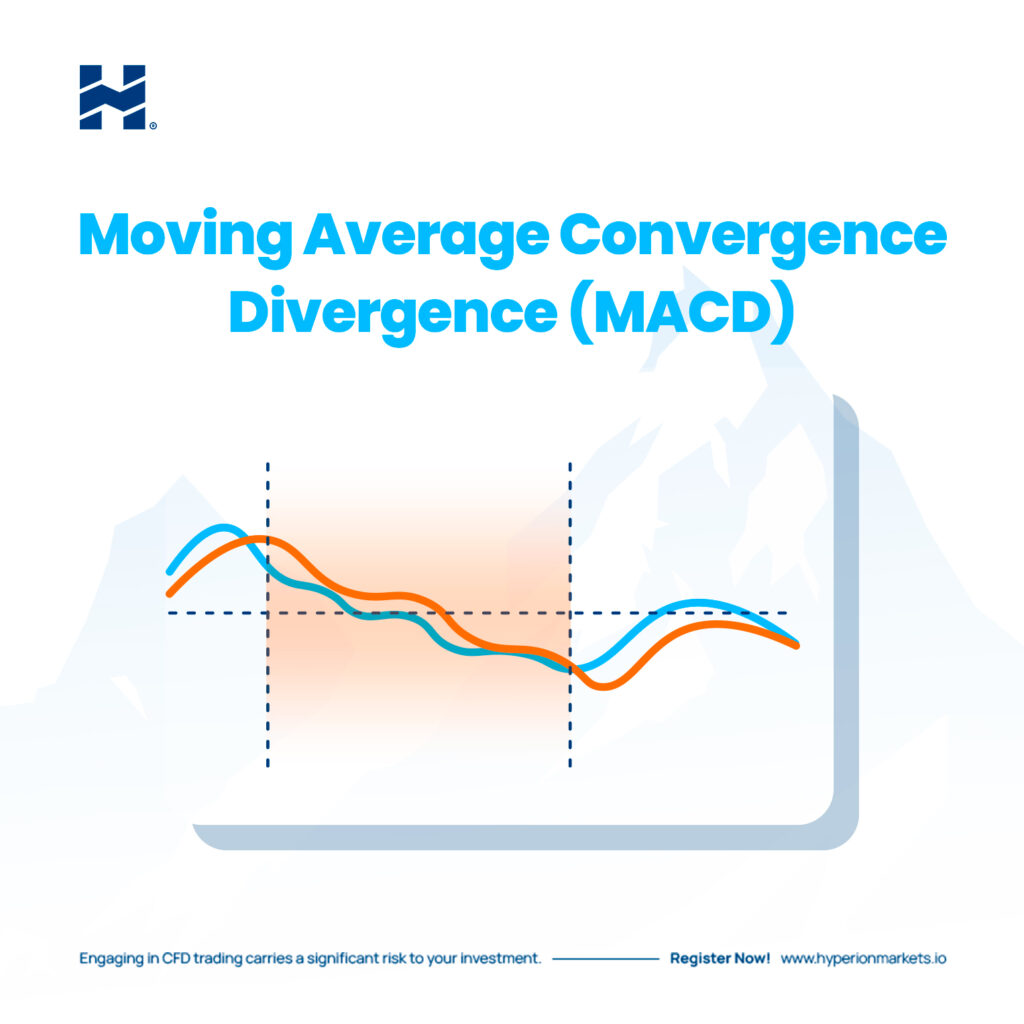
MACD (Moving Average Convergence/Divergence)
MACD is an indicator that combines moving averages and helps identify changes in trend direction. It consists of two lines, the MACD line and the signal line, which cross to give buy or sell signals.
Stochastic
The stochastic indicator is used to measure the speed of price and its relationship to recent highs and lows. It helps identify overbought and oversold conditions and generates buy or sell signals.

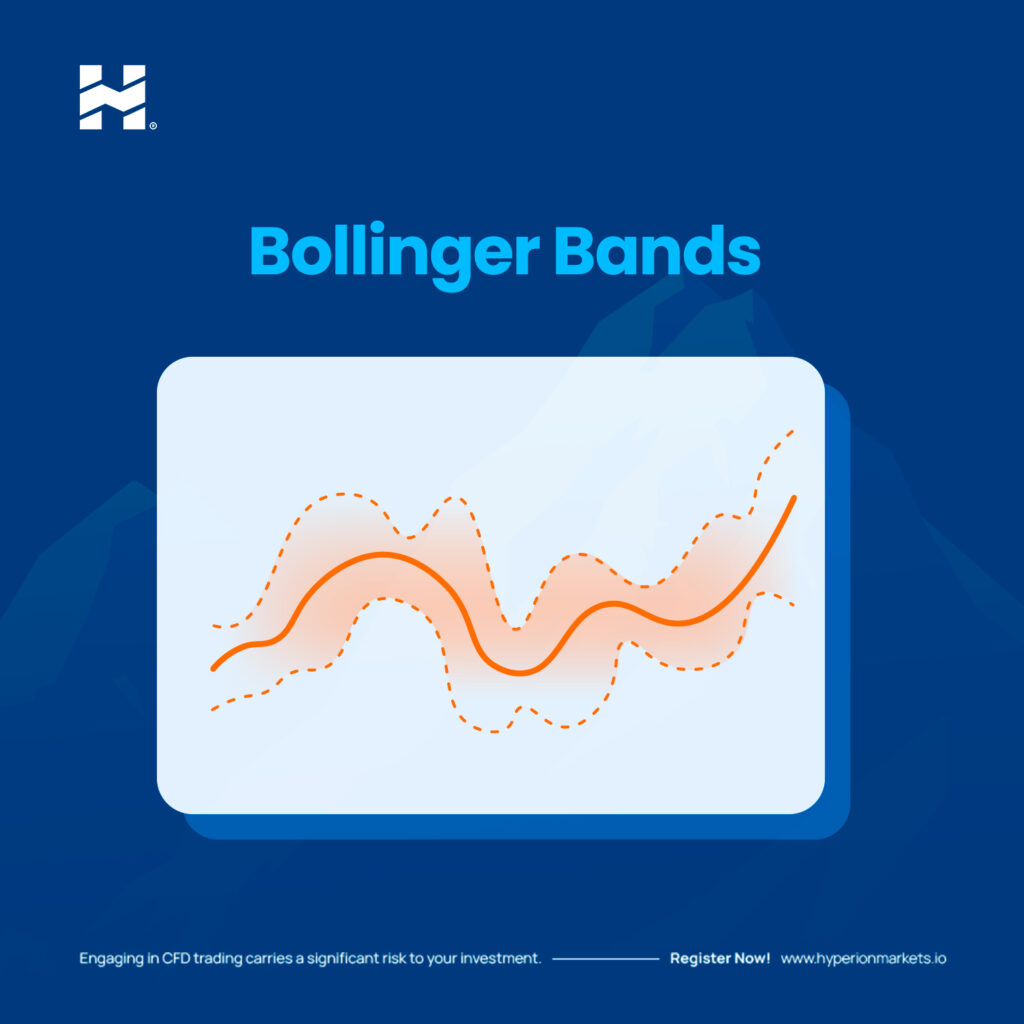
Bollinger Bands
This indicator consists of three bands: a middle band (SMA), an upper band (SMA + standard deviation), and a lower band (SMA – standard deviation). Bollinger Bands help measure market volatility and identify potential reversal points when prices approach the bands.
Volume
Analyzes trading volume to confirm price trends and identify potential reversals.
