Trendlines and Psychological Levels
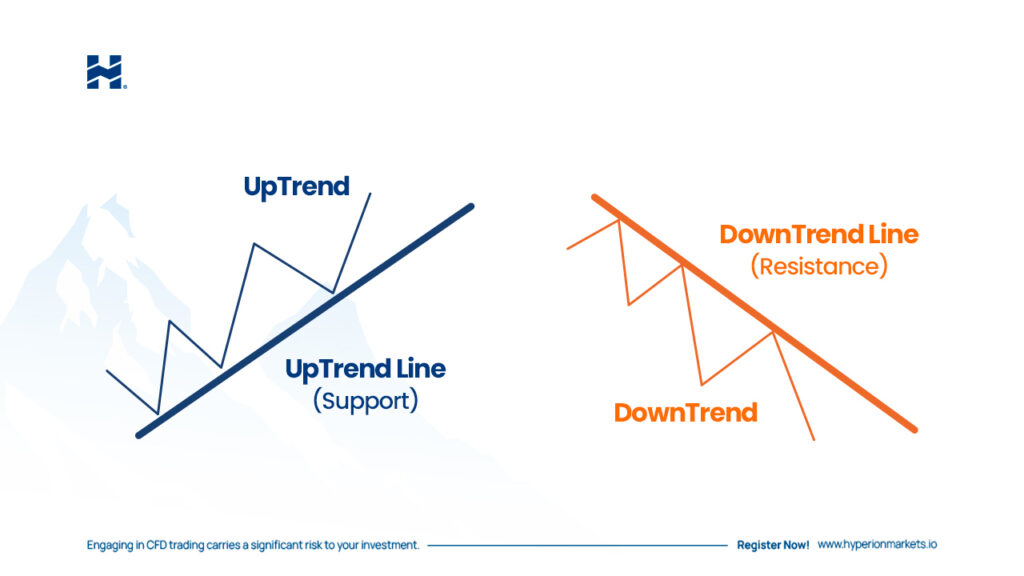
“Trendlines” are essential tools in technical analysis used to identify and visualize trends in the prices of financial assets. These lines are drawn on a price chart and help traders understand the overall direction of a market and potential reversal points. Here’s key information about trendlines:

- Uptrend Line: Drawn by connecting two or more ascending lows on a chart. These lines represent an uptrend and suggest that prices have a tendency to rise.
- Downtrend Line: Drawn by connecting two or more descending highs on a chart. These lines represent a downtrend and suggest that prices have a tendency to fall.
- Sideways or Horizontal Trendline: Drawn by connecting two or more reversal points in a horizontal price range. These lines indicate that the price is trading within a specific range and does not show a clear trend.
“Psychological levels” are key price points in a financial asset that often have a strong impact on trading decisions due to psychological reasons. These levels are not based on traditional technical analysis, such as chart patterns or indicators, but on traders’ and investors’ perception and behavior. Some common examples of psychological levels include:
- Round Numbers: These are price levels that end in round figures, such as 10, 100, 1,000, etc. Traders tend to pay special attention to these levels and often use them as entry or exit points for positions.
- Parity Numbers: These are prices that end in multiples of 50 or 100, such as 50, 150, 500, etc. These levels also have strong psychological appeal and can act as areas of support or resistance.
- Historical Price Levels: Price levels at which an asset has previously experienced reversal or consolidation can also be considered psychological levels. Traders may expect these levels to be important in the future.
- Profit or Loss Levels: When traders reach certain levels of profit or loss in their trades, they may make decisions based on psychological considerations such as loss aversion or profit satisfaction.
