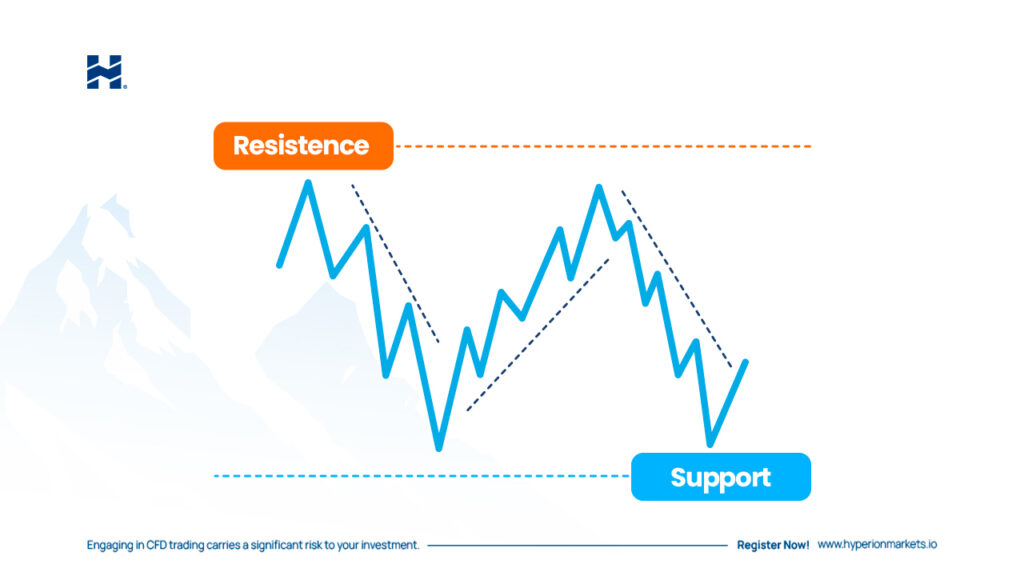
Support and Resistance
Support and Resistance are fundamental concepts in technical analysis used in trading and investing. These levels represent areas on a price chart where movements of an asset are expected to encounter significant obstacles.
| Support | The support level is a price or zone on a chart where demand is expected to be strong enough to halt or reverse a downtrend. |
| It acts like a “floor” on the chart, where the price tends to bounce upwards. Investors view the support level as a good point to buy, as they expect prices to rise from that point. | |
| Resistance | The resistance level is a price or zone on a chart where supply is expected to be strong enough to halt or reverse an uptrend. |
| It acts like a “ceiling” on the chart, where the price tends to pull back. Investors view the resistance level as a good point to sell, as they expect prices to fall from that point. |

The concept of support and resistance is based on the idea that investors remember and react to historical price levels. When the price approaches a support or resistance level, significant events such as pullbacks, breakouts, or consolidations are likely to occur.
